From: Muhammad Faizan Raza
Clustering Exercise
Data Collection
For this step of my assignment, I decided to go with 30 different food pictures from around the world. I selected foods from different cuisines such as Mexican, Indian, Chinese and Thai. However I chose different types of foods such as salads, main courses and desserts so the cuisine is not the only classification they are based on as instructed by the Professor. The data collection process involved me searching up a list of famous traditional foods from the mentioned cuisines and then going to different websites and downloading images of the shortlisted foods.
Data Processing
After the pictures were downloaded, labelled relevantly and put into the folder, I loaded the folder into orange using the import photos tool. Then I followed the pipeline mentioned in video 14 of the orange tutorial playlist to pass the images into the data table, then into the image embeddings, then into the distances calculator and then the hierarchical clustering tool. At the end I connected the image viewer to the clustering tool to visualize the images in the clusters together.
Analysing Clusters
Before looking at the dendogram, my hypothesis was that since the curry based dishes are usually orange-ish in colour they would be paired together, the salads paired together because of the greens in them and desserts because of the general ingredients and colors they share throughout the globe. I was also interested to see if it could detect certain ingredients in the dishes and pair them according to the cuisines. I tried all the different types of image embeddings and although the clusters werent very remarkable accross all types, the VGG-19 Image embedding made the most reasonable groups.
Let us examine the photo grid that it generated:
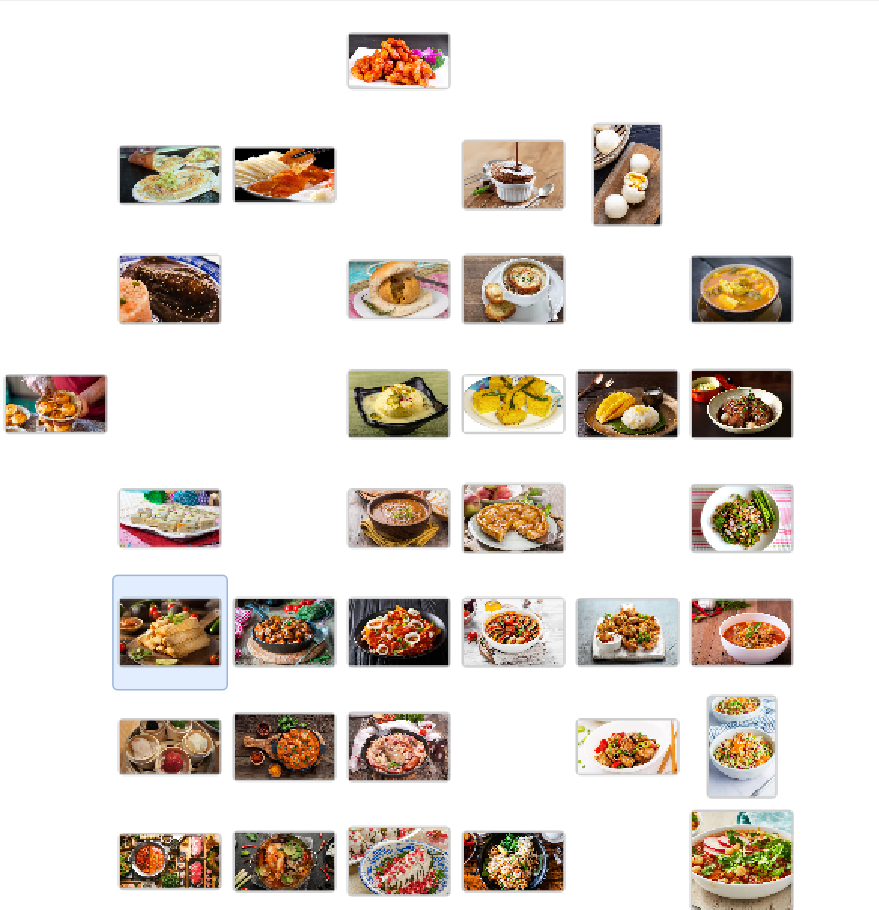
Some themes that are very obvious are the curry based dishes are coupled together in the bottom left corner and are predominantly orange in colour with greens and other colours infused in it. Other patterns that are also exvident include the presence of dishes in white bowls at the right bottom corner of the grid. However this kind of skews the analysis as the program does not focus on the dish but the container in it. Two dishes that I thought would be together were the desserts barfi and Li Sha Bao however due to the drastic changes in their table colours the photo grid put one at the extreme top and one at the left side of the grid which is another observation that the external factors disturb the actual analysis of the dishes.
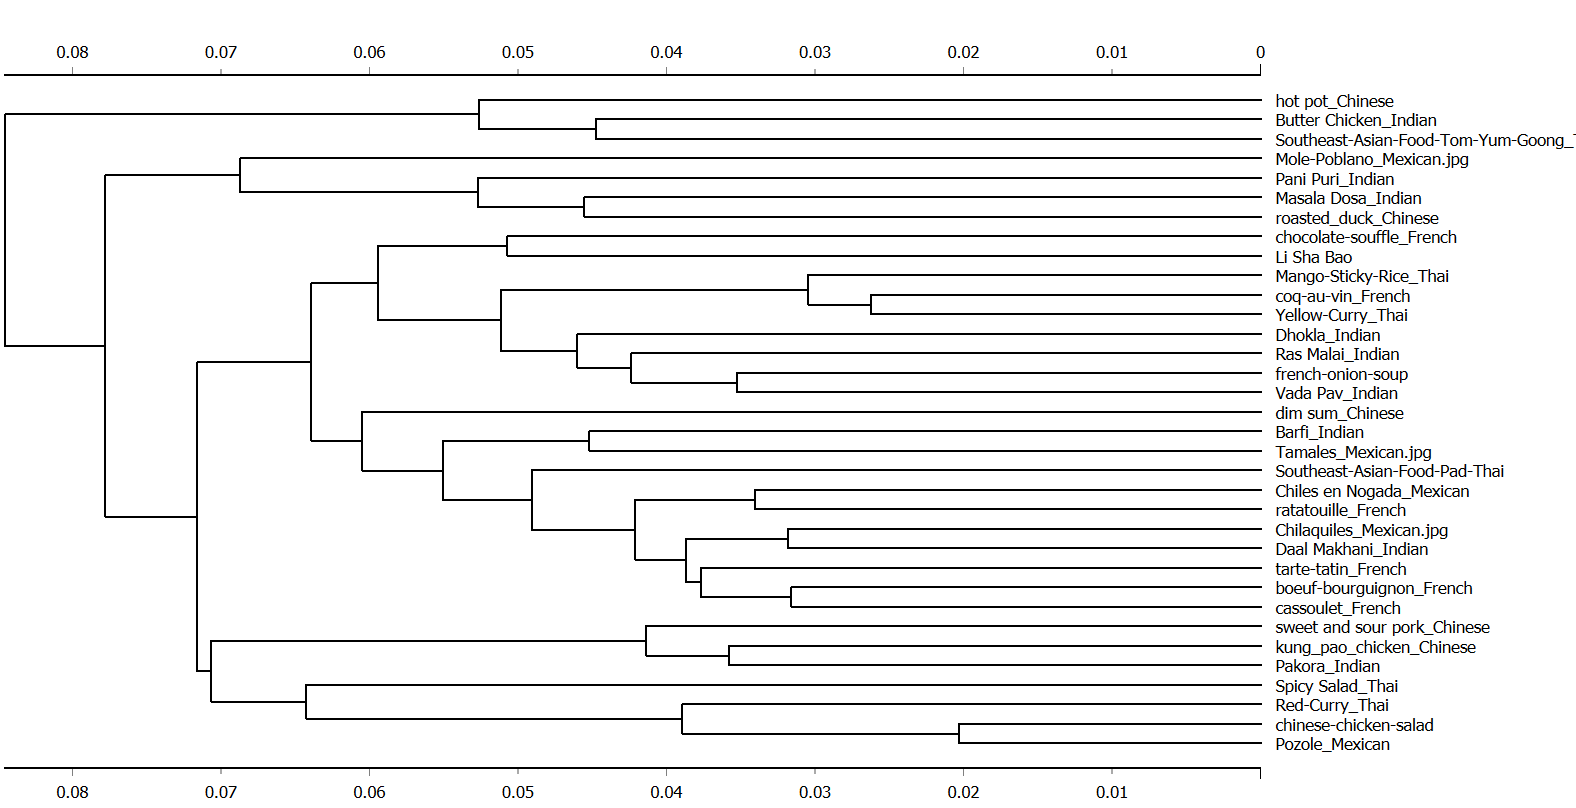
Along with the grid, the dendogram that the program generated is given below:
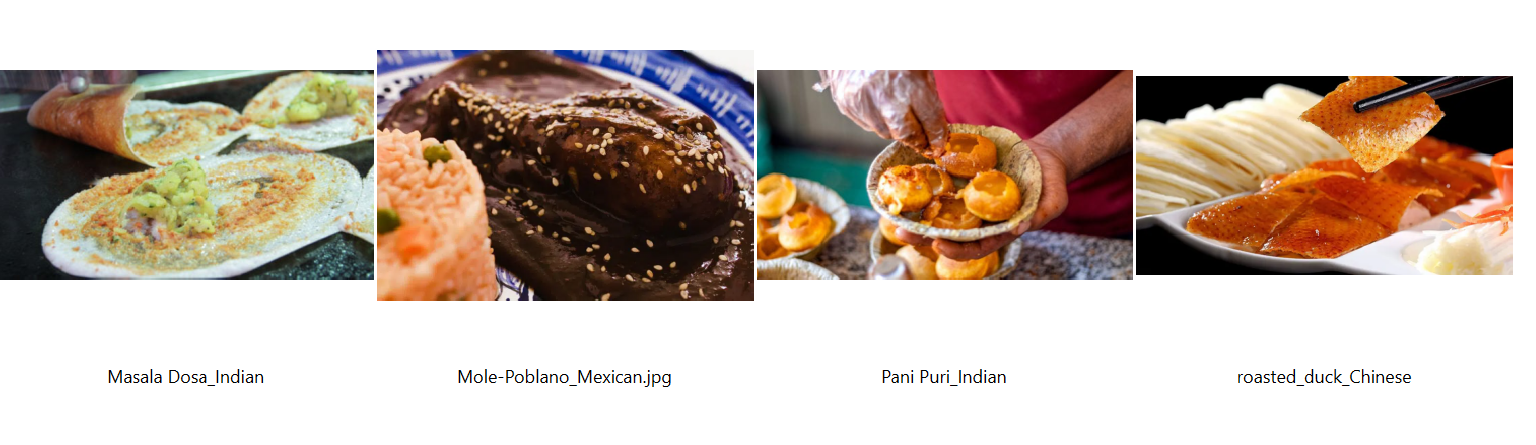
Analyzing the cluster of these four food items, we can see that all the foods have some sort of a yellow textured staple food in them and the colour is what is distinguishing them from the others. This is a recurring theme in most of the clusters where the groups are made according to the combination of coloured items in them.
Classification Exercise
Data Collection
For this step of the assignment, I aimed to collect a datatset of 100 images from different instagram nature photographers. I tried using internet tools to download instagram photos from photographers but soon realized that doing one by one image would take very long so I decided to write a python script for it. The script is available in the nature photographers folder in the assets folder. I came accross this website called instaloader and incorporated that in my script. The I shortlisted some photographers and downloaded photos from their top 10 most liked posts and saved into folders. A problem I came across was that it downloaded a lot of photos for posts with multiple photos and for some photographers, their most liked post was a video. So after examining the folders I decided to download top 15 most liked posts of some photographers and then filtered out 10 distinct photos that I liked. The script also downloaded metadata for the photos which I deleted for the purpose of this project but it is something that could be used if somebody wants to incorporate text analysis into this project.
Data Processing
For this step, I just took the orange file template professor provided in his drive including the image grid, confusion matrix, logistic regression and more. Then I just used the import files feature to upload the folders together and rest of the processing happened itself.
Data Analysis
My initial hypothesis was that since a lot of photographers used a lot of very distinct presets and colors they will be paired together in the classes however some of the photographers took photos of similar animals or landscapes so I thought that could lead to a picture of one photgrapaher linked to another photographer. Following is the confusion matrix of the images
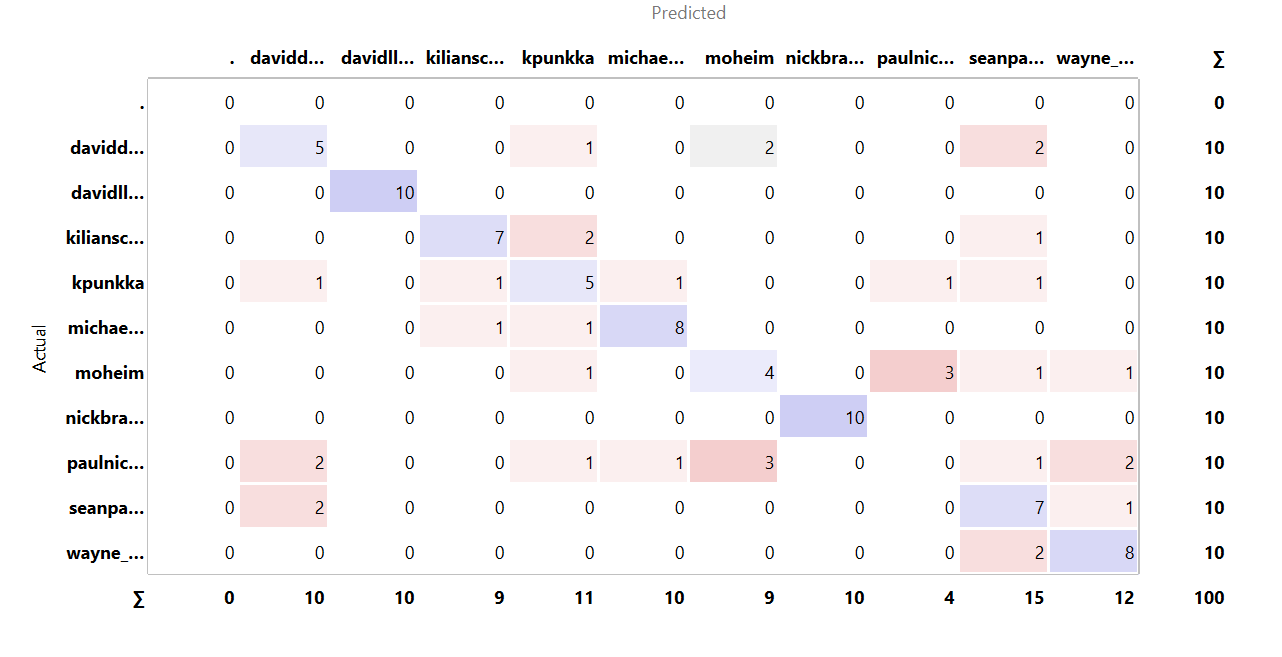
The testing statistics of the classification are given as follows:
- AUC: 0.932
- CA: 0.640
- F1: 0.622
- Precision: 0.611
- Recall: 0.640
Although the high AUC shows the ability of the classifier to distinguish between classes well, the Accuracy at 0.640 shows that the model was not able to put the images into their relevant classes as successfully as was expected because of the overlapping themes amongst the photographers.
Lets look at first the david lloyd images whose pictures are all predicted correctly:
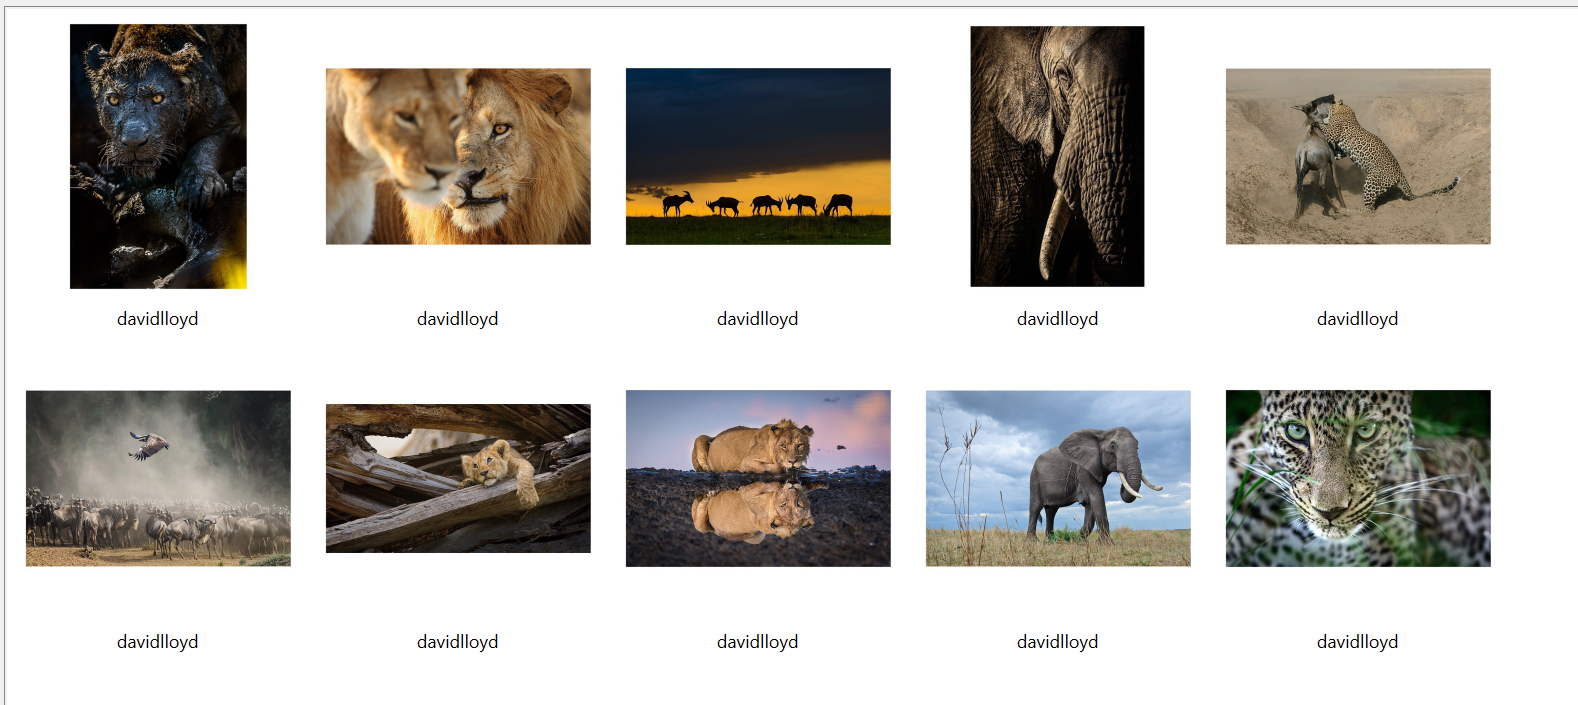
Examining the pictures we can see that most of the pictures are of animals that have similar aesthetics or live in similar regions hence the similar background. All the photos seem to be have underwent similar colour grading and hence the program is probably detecting those
Another photographer for which the program detected the pictures correctly was Nick Brandt:
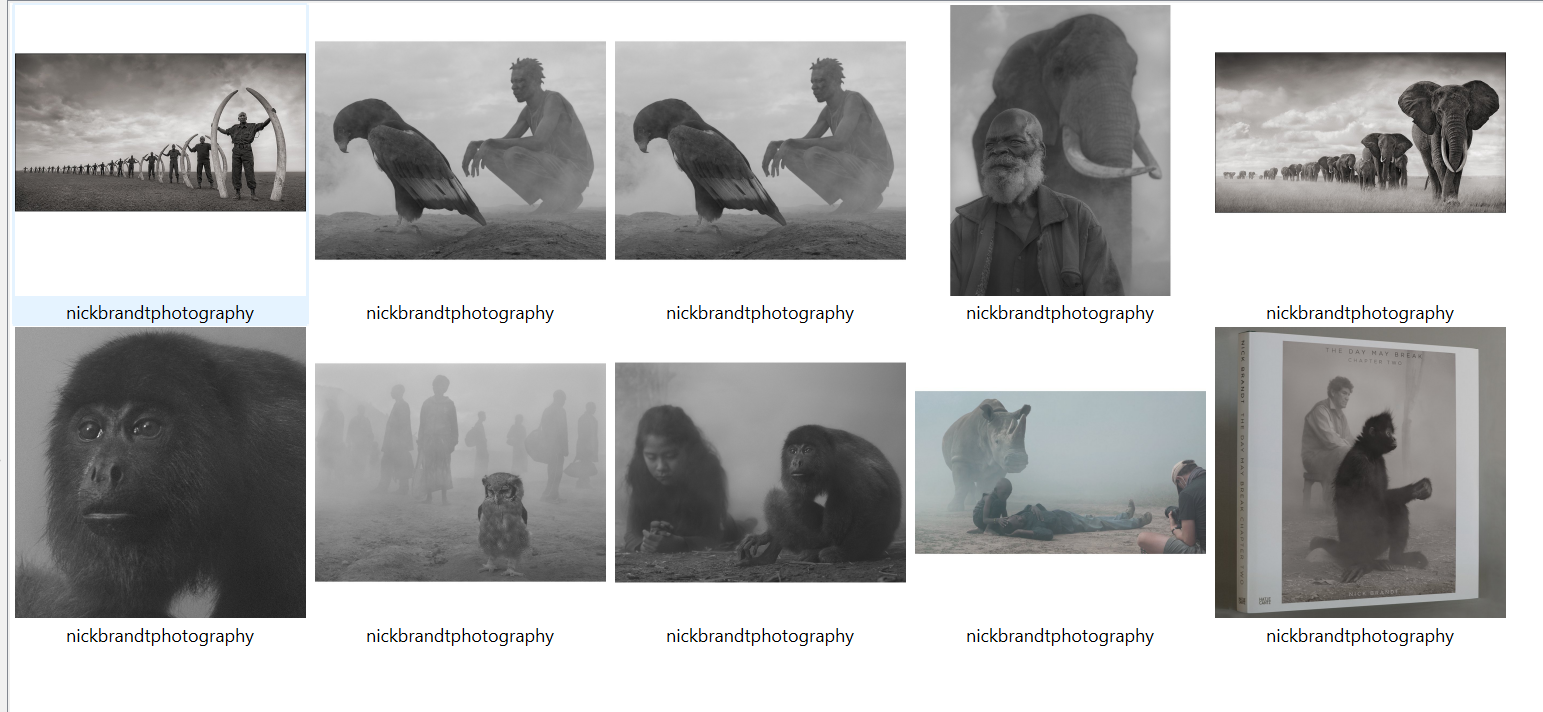
Here the difference that sets out these set of images is very clear and its the grayscale images that the program detected very easily.
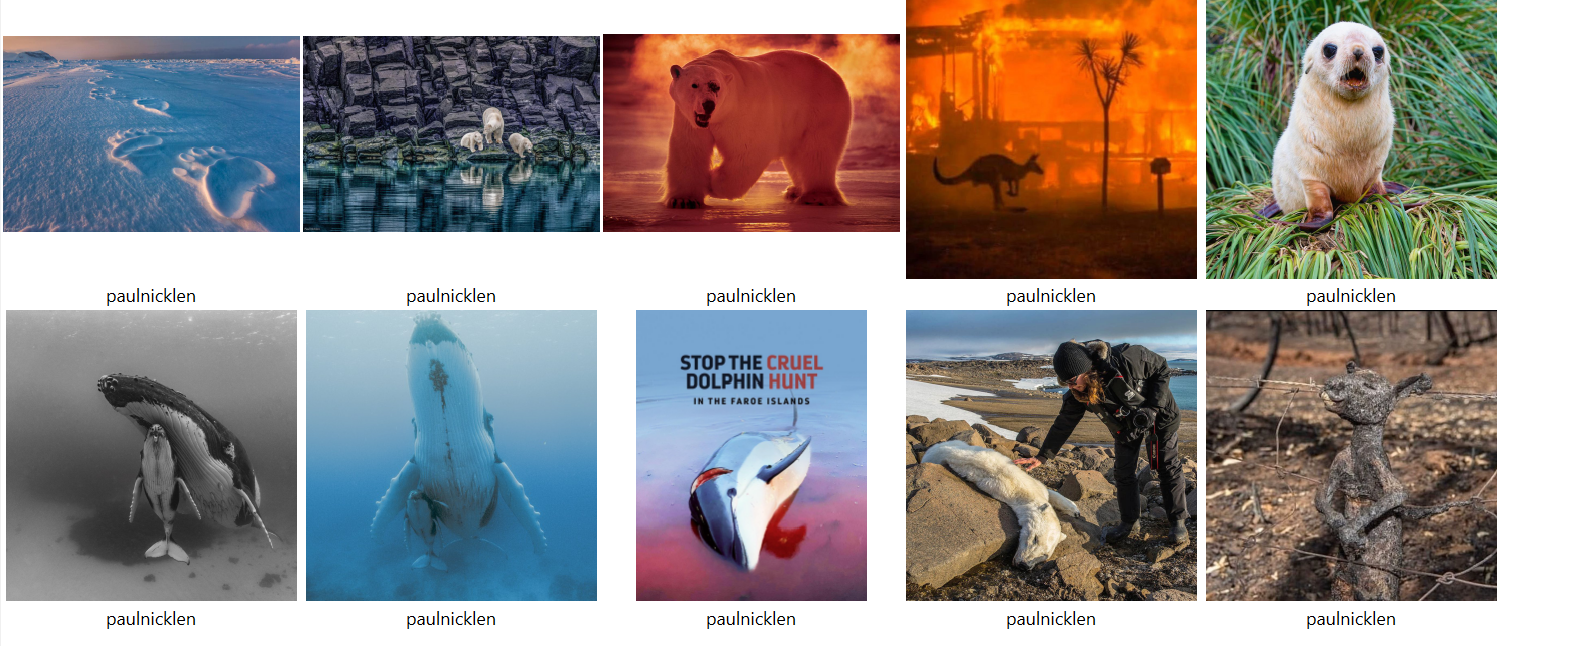
One interesting case to look at is of the photos of the photographer Paul Nicklen whose no actual photos were predicted as his own and were evenly divided amongst the other photographers. As we can see there are no obvious similarities amongst the photos as the photos are of completely different objects and have no seemingly common color schemes or backgrounds
Conclusion
In Conclusion, although the program picked some common themes in the photographs but as mentioned earlier in the second step the utensils caused a lot of skewness in the analysis and in the second dataset some of the shared colours and animals caused a not very accurate distinction between the photos of the photographers.
Reflections
Although I have mentioned reflections throughout the piece along the process. Something I thought of while doing the project was that the metadata that the script downloaded of the Instagram posts could be used along the photos to describe the photos using natural language processing and to learn how a certain creator captions their images. This is in line with the “How We Teach Computers to Understand Pictures” video we covered in the syllabus which mentioned how the next step after identifying images was to how to describe them and I think this could be used in that direction. Another thing that I noticed was that when doing the classification exercise, I tried to use different embedding techniques but orange was giving an error with most of them and only the painters and vgg-19 worked but I am not sure of the reason of why this happened, this did not happen with the clustering exercise.
References
- “Getting Started with Orange 14: Image Analytics - Clustering.” YouTube, Orange Data Mining, 13 Apr. 2017, https://www.youtube.com/watch?v=Iu8g2Twjn9U&list=PLmNPvQr9Tf-ZSDLwOzxpvY-HrE0yv-8Fy&index=14. Accessed 17 May 2023.
- “How We Teach Computers to Understand Pictures.” Performance by Fei Fei Li, YouTube, TED, 23 Mar. 2015, https://www.youtube.com/watch?v=40riCqvRoMs. Accessed 17 May 2023.